To create an alert, follow the steps in this article:
Creating and configuring alerts![]()
To enable alert notifications and assign them to an assignee, please follow the steps in this article:
Setting/assigning alert notifications![]()
Content
Open
Navigate to the Alert tab.

Overview
Here you can see all triggered alerts in one overview.
Customize Overview
You have several options to individually customize and filter the overview.
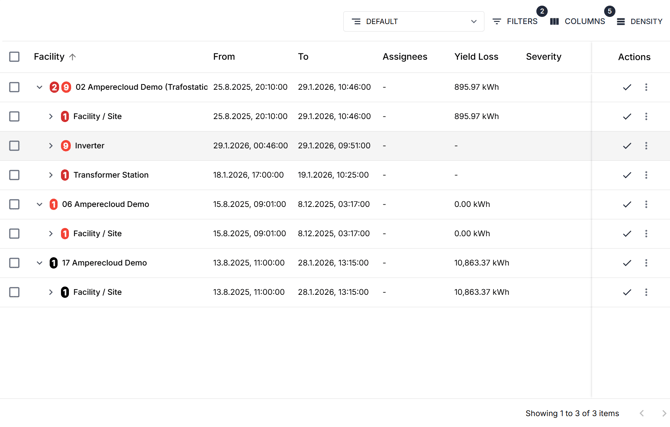
Default View
![]()
The default view shows:
-
All facilities you have access to
-
All alerts that are not suppressed
No filtering is required to see relevant alerts.
Custom Views (Saved Filters)
You can create your own view with filters:
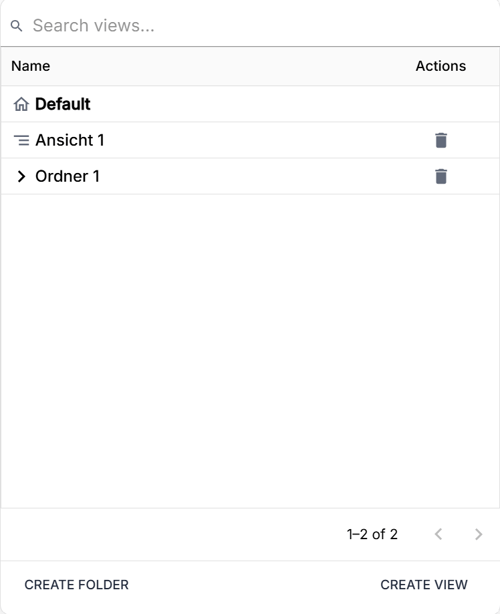
Examples:
-
Only a specific status
-
Only a specific site
-
Only specific columns
Once saved, you can return to this view without reapplying filters.
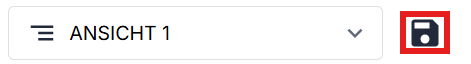
This is especially useful for recurring checks.
Filter
Click on the filter at the top right of the overview.
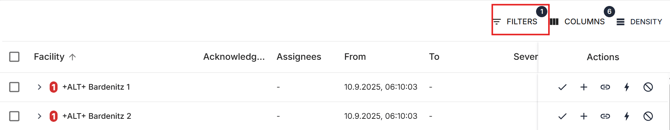
Under the Columns, select the column you want to filter.
In the adjacent box on the right side, you can choose the desired filter option.

The following columns can be filtered:
- Acknowledged
-
Alert Types
-
Assignees
-
From (Date)
-
Status
-
To (Date)
You can add as many filter options as you like by clicking + Add Filter.
With the Clear All button, you can remove all filter settings.

Columns
Click on Columns at the top right of the overview.
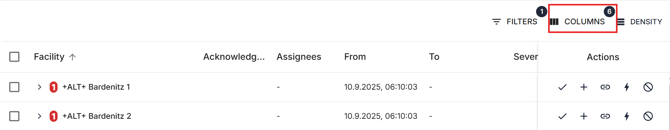
Here you can select the different columns you want to display in the overview.
Each column has a toggle that lets you make the column visible or invisible.

With the Show All and Hide All buttons, you can make all columns visible or invisible.

By moving your mouse cursor between the column headers, you can reorder them and adjust their width.
Density
Click on Density at the top right of the overview.
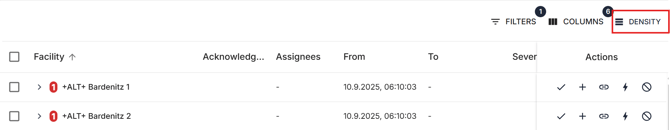
Here you can adjust the size of the individual rows.
The following settings are available:
-
Compact
-
Standard
-
Comfortable

The black number above the adjustment option shows the number of changes made.
.
Structure Layout
The structure is displayed hierarchically, similar to the Digital Twin.
Expand the individual components to display the ones below.

The number next to each component indicates how many alerts are under it.
The color reflects the severity of the alert.
Alert Hierarchy
The alerts are structured in five levels:
-
Facility level (top level)
-
Device Type level (inverter, meter, strings, data logger, etc.)
-
Alert Type level (e.g., “No data acquired”, “Low generation”)
-
Device level (specific inverter, meter, etc.)
-
Alert Event level (individual alert instances)
This hierarchy allows users to understand problems from a high level down to the exact device and event.
Rule
The system does not count individual alert events blindly.
-
If one device has the same alert type 10 times → counts as 1
-
If two devices have that alert → counts as 2
This allows you as a user to immediately understand how many devices are affected instead of how many alert messages exist.
Investigating a Specific Device or Alert
If you want to investigate, for example, a specific inverter:
-
Go to the facility
-
Open Device Types → Inverters
-
Select the relevant Alert Type
-
Open the device
-
View the exact alert events
You can always check the level above to understand:
-
What alert type it is
-
What the severity is
-
How many devices are affected
Actions
Click the checkbox next to a component or alert to select it. Alternatively, you can use the topmost checkbox to select or deselect everything.
Selecting a parent component also selects all children.
Once you have selected one or more objects, several actions are available.
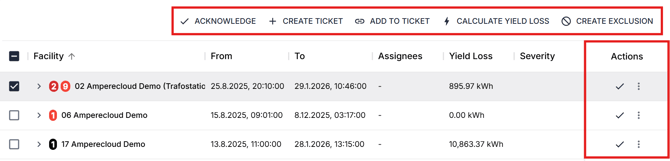
Different actions can be performed either via the Actions menu or via the buttons above the overview.
Acknowledge  :
:
Click Acknowledge when an alert has been acknowledged. These alerts can now be easily filtered out.
Create Ticket  :
:
Here you can create a new ticket for the alert. For more articles on tickets, please refer to the Knowledge Base under:
Add to Ticket  :
:
Here you can add an alert to an existing ticket. For more articles on tickets, please refer to the Knowledge Base under:
Calculate Yield Loss  :
:
Here you can calculate the yield loss. For more information on yield loss calculation, please refer to the following article:
Create Exclusion  :
:
Here you can create an exclusion for the alert group. For more information on exclusions, please refer to the following article:
Need More Help?
If you encountered any difficulties or need further assistance, here are some steps you can take:
Contact Support:
- Email: Reach out to our support team by emailing us at support@amperecloud.com. Provide as much detail as possible about the issue you're facing.
- Fill out a form: Complete our online support form. Please include all relevant information about your request, and our team will get back to you as soon as possible.
Share Your Feedback
If this article didn’t meet your needs or if you have suggestions on how we can improve, please let us know by submitting feedback. Your input helps us enhance our resources and support.