Step-by-step instructions
1. Create chart
- Navigate within the platform to the Dashboards tab.

- Select the desired dashboard to which you want to add the widget.

- Click on the “Add element” button and then on the desired widget.

2. Set title
First determine the title that will be displayed in the top left-hand corner of the widget once the configuration is complete.
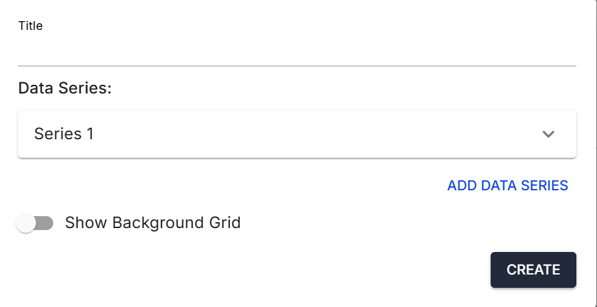
3. Add data series
-
Configure data series: Add as many data series as you like and configure them individually.

4. Data series - type and color
-
Select title and type: Assign a title to the data series or data series and select the type ( line, bar).

- Set color: Determine the color of the data series.

5. Manage Devices
Click on Manage Devices.
Choose between:
Dynamic Devices
A widget with dynamic devices automatically updates its content based on the plant selected in the Plant Selection.
Static Devices
A widget with static devices does not update its content based on the plant selected in the Plant Selection.
5.1 Define Components (Dynamic Devices)
Under Facility Selector, choose the desired plants (multiple selections possible).
Under Device Type, select the desired device type.
With the Facility Selector widget, you can:
-
Select all accessible plants
-
Use a dropdown or step-through selection directly on the dashboard

5.2 Define Components (Static Devices)
-
Define components: Determine the components from which the data for the widget should be obtained. Filter by:
- A: Name in the system editor
- B: System in which the device is installed
- C: Device type
You will find a list of the available devices under D and the devices selected for the widget under E. You can select or remove devices via area F.

6. Configure data
-
Readings or analysis data: Specify whether the widget should display "Measured values" or "Analysis data".

7. Set analysis data
-
Analysis type: Select the type of analysis.
-
Period: Specify the period.
-
Interval: Specify the interval at which the values are updated.

8. Set Readings
-
Readings: Select the Readings to be displayed.
-
Period: Determine the period of the display
-
Aggregation (cumulation): Specify the type of aggregation (e.g. MAX, MIN, SUM, AVG, LAST, FIRST, COUNT).

ℹ INFORMATION
Below each aggregation (cumulation):
- MAX - the maximum value achieved in the specified period
- MIN - the minimum value achieved in the specified period
- SUM - the sum calculated for the specified period
- AVG - the average achieved in the specified period
- LAST - the last (most recent) value determined
- FIRST - the first value determined in the specified period
- COUNT - the number of values transmitted
Example for "COUNT":
If a device transmits a value every 15 minutes (4 times per hour), the "COUNT" value for this device will be 96 for a period of one day.
9. Adjust and edit widget size
-
Change the size of the A widget: In the bottom right-hand corner of the widget, you will find an arrow with which you can adjust the size of the widget.

- Customize widget: Move the mouse pointer towards corner A to display the pen for editing the widget.

Need More Help?
If you encountered any difficulties or need further assistance, here are some steps you can take:
Contact Support:
- Email: Reach out to our support team by emailing us at support@amperecloud.com. Provide as much detail as possible about the issue you're facing.
- Fill out a form: Complete our online support form. Please include all relevant information about your request, and our team will get back to you as soon as possible.
Share Your Feedback
If this article didn’t meet your needs or if you have suggestions on how we can improve, please let us know by submitting feedback. Your input helps us enhance our resources and support.