You can use the table widget function to display various types of data in tabular form, e.g. performance, analysis data or information from the digital twin. How to create a table widget:
1. Create chart
- Navigate within the platform to the Dashboards tab.

- Select the desired dashboard to which you want to add the widget.

- Click on the “Add element” button and then on the desired widget.

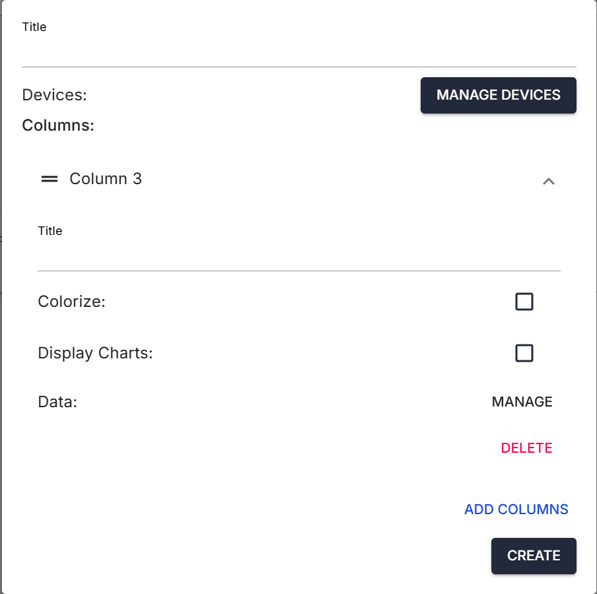
2. Set title
- Give the widget a title that will be displayed in the top left corner of the widget.

3. Add columns
- Step 1: Click on "Add column" to add a new column to the table.
- Step 2: Assign a title to each column.
- Step 3: Specify whether the column should be colored to visually highlight values. The colors are based on the following rules:
- Green: device with the highest value or average values
- Red: Values that are below the average
4. Configure data
Click on manage.
You must decide whether the widget should display readings, analysis or data from the digital twin.

4.1 Analysis data
If the table is to display analysis data:
- Step 1: Select "Analysis data" in the configuration menu.
- Step 2: Define the analysis type (e.g. average, trend).
- Step 3: Determine the time period to be analyzed.
- Step 4: Set the interval at which the data is to be updated.

4.2 Readings
If the table is to display Readings:
- Step 1: Select "Readings" in the configuration menu.
- Step 2: Determine the specific measured value (e.g. current power).
- Step 3: Define the time period that the widget should cover.
- Step 4: Set the aggregation (e.g. MAX, MIN, SUM, AVG, LAST, FIRST, COUNT) how the data should be displayed cumulatively.

4.3 Digital twin
If the table is to display data from the digital twin:
- Step 1: Select "Digital twin" in the configuration menu.
- Step 2: Determine which specific data from the digital twin should be displayed, such as name, serial number, model, etc.

4. Manage Devices
Click on Manage Devices.
Choose between:
Dynamic Devices
A widget with dynamic devices automatically updates its content based on the plant selected in the Plant Selection.
Static Devices
A widget with static devices does not update its content based on the plant selected in the Plant Selection.
4.1 Define Components (Dynamic Devices)
Under Facility Selector, choose the desired plants (multiple selections possible).
Under Device Type, select the desired device type.
With the Facility Selector widget, you can:
-
Select all accessible plants
-
Use a dropdown or step-through selection directly on the dashboard

4.2 Define Components (Static Devices)
- Step 1: Select the components whose data is to be displayed in the widget.
- Step 2: Use the filter options to search for specific devices:
A: Device name
- A: Device name
- B: Associated system
- C: Device type
- Step 3: Select the desired devices in the list D.
- Step 4: Add the selected devices to list E.
- Step 5: You can remove devices from the selection via area F.

Below each aggregation (cumulation)
- MAX: Highest value in the specified period
- MIN: Lowest value in the specified period
- SUM: Sum of all values in the specified period
- AVG: Average value in the specified period
- LAST: Last (most recent) value in the specified time period
- FIRST: First value in the specified period
- COUNT: Number of transmitted values
Example for "COUNT": If a device transmits a value every 15 minutes (4 times per hour), the "COUNT" value for this device will be 96 for a period of one day.
Need More Help?
If you encountered any difficulties or need further assistance, here are some steps you can take:
Contact Support:
- Email: Reach out to our support team by emailing us at support@amperecloud.com. Provide as much detail as possible about the issue you're facing.
- Fill out a form: Complete our online support form. Please include all relevant information about your request, and our team will get back to you as soon as possible.
Share Your Feedback
If this article didn’t meet your needs or if you have suggestions on how we can improve, please let us know by submitting feedback. Your input helps us enhance our resources and support.